Read your analytics dashboard
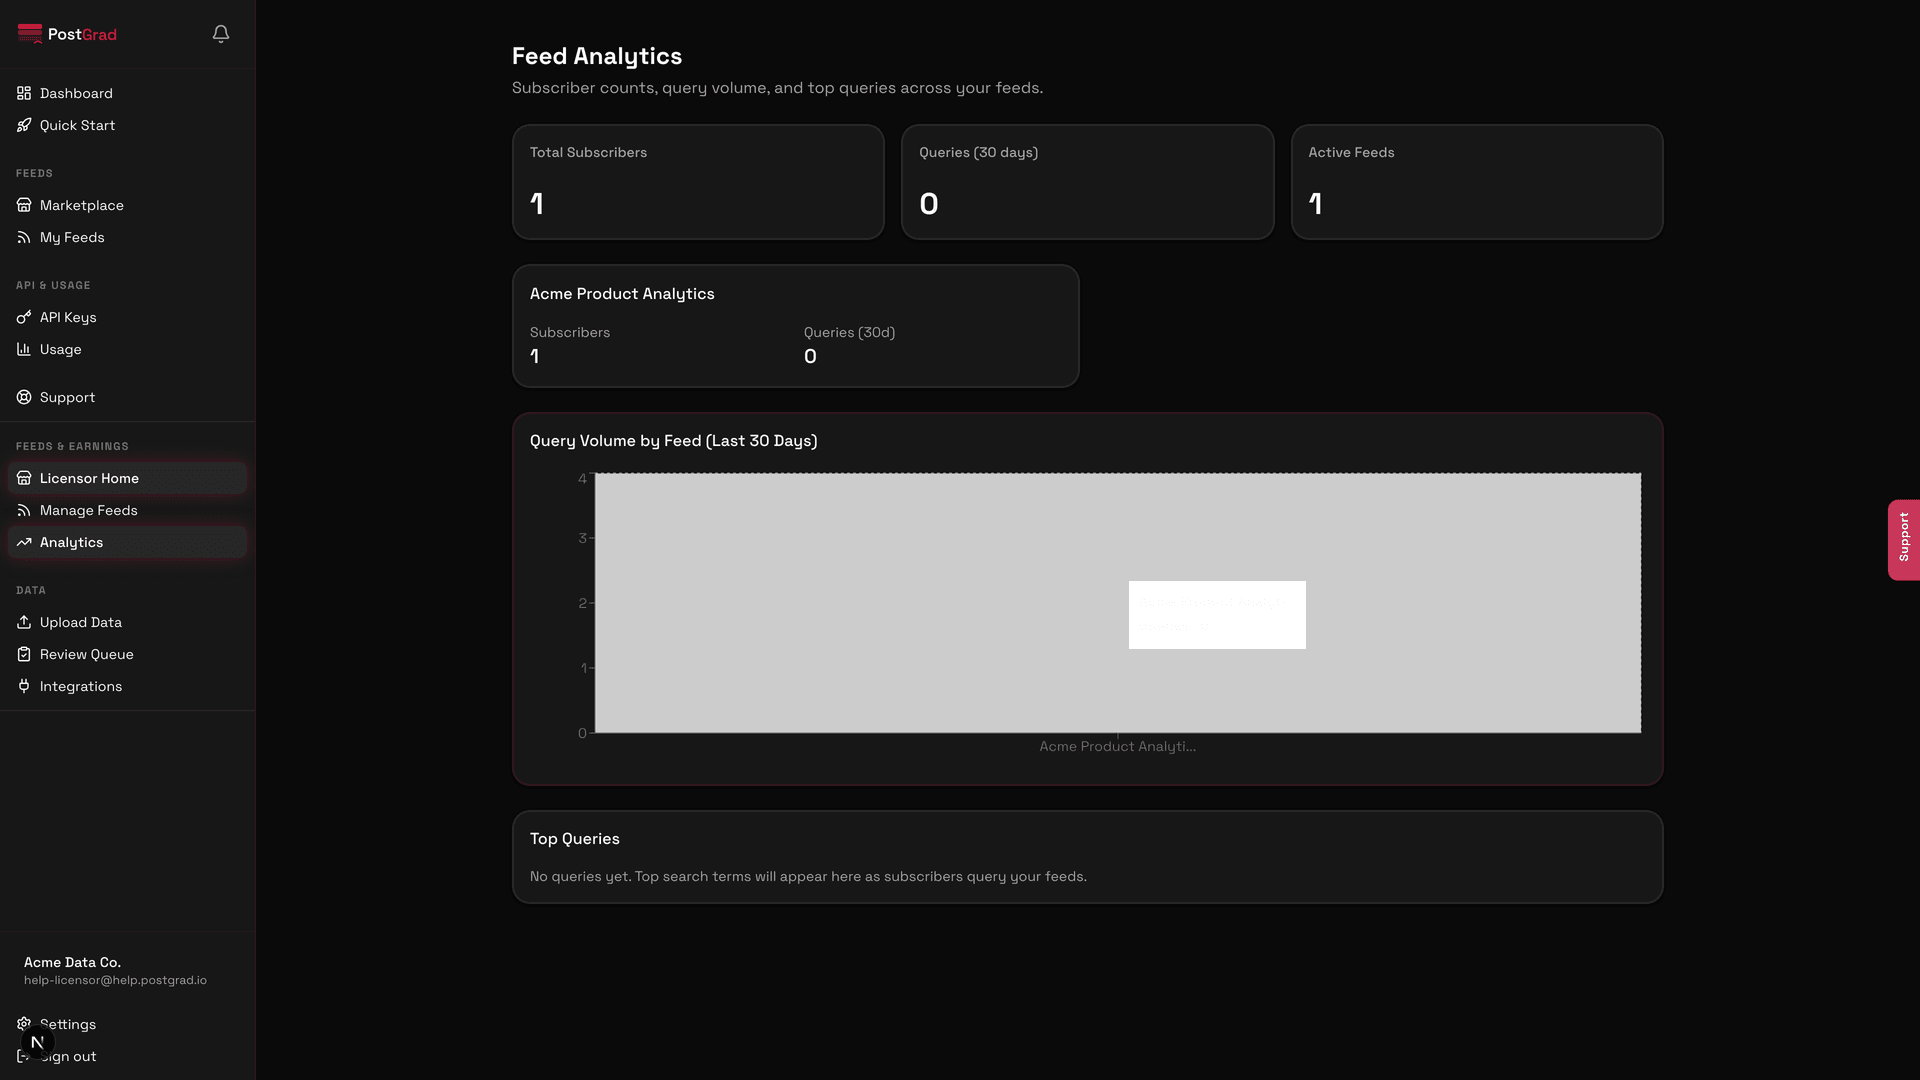
Navigate the licensor analytics page — subscriber counts, per-feed revenue, query volume, and top-performing entries — so you know what's working.
The licensor analytics dashboard is the single page that answers "is my feed making money?" and "which entries are subscribers actually querying?" — everything else in the licensor dashboard flows from these numbers.
Before you start: you have at least one published feed with some subscribers and query traffic (Create your first feed).
Open Analytics from the licensor sidebar

Drill into per-feed performance

The trend arrows are thirty-day. Red isn't inherently bad — a specialty feed can plateau at a healthy subscriber count — but a sustained drop across every metric for a feed usually means content freshness has lapsed.
See subscriber growth over time
Inspect top-queried entries

Export the data if you need it elsewhere

What's next
- Understand payouts — Get paid explains how the revenue number on this dashboard becomes money in your bank account.
- Improve under-performers — Review and publish entries if a feed is losing subscribers, refresh content.
- Tune for precision — Configure extraction settings if a feed's entries don't match what subscribers are querying.
Configure extraction settings
Tune the confidence floor, PII scrubbing, category whitelist, and source filters so PostGrad extracts the knowledge you actually want.
Get paid
Understand PostGrad's payout cadence, platform fees, and Stripe transfers so you know when and how money arrives in your bank account.